
QATC Survey Results
This article details the results of the most recent QATC quarterly survey on critical quality assurance and training topics. Over 100 contact center professionals representing a wide variety of industries provided insight regarding social media monitoring and quality assessment processes.
Number of Agent Seats
The largest number of participants is from call center operations with over 500 seats (35%). However, the balance is widely dispersed across ranges from under 50 agents up to 500 seats. The industries represented by the participants is widely dispersed as well. This provides a good representation of all sizes of centers and industries.
Social Media Channels
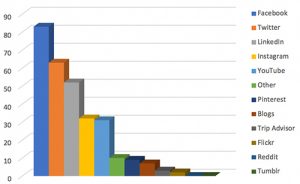
Respondents were asked which social media channels are used in their organizations and multiple channels could be selected. Facebook was used by the highest number of respondents with Twitter and LinkedIn both used by more than 50%. Other channels are also used to a lesser extent and the choices are likely driven by the type of business and the channels preferred by the customer base.
Channel Monitoring
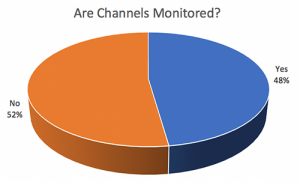
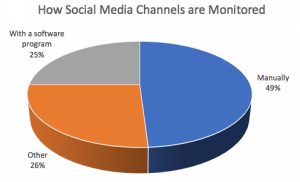
When asked whether the organization monitors the social media channels, slightly less than half indicated that they do monitor. When asked how this monitoring is done, approximately half of the respondents indicated that it is a manual process, while 25% are using a software program.
Software Programs Used for Monitoring
Respondents were asked to identify the software tools used for social media monitoring. The following options were mentioned:
- Hootsuite
- Sprout
- Sprinklr
- Birdseye
- Conversocial
- Khoros
- Bazzarvoice
- Tweetdeck
- Lithium
- Zendesk
Who Responds to Social Media
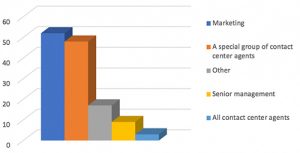
Survey participants were asked who is responsible for responding to social media interactions. Marketing received the highest number of selections but specialized contact center agents is close behind. Only a few are answered by senior management and even less by all agents in the center.
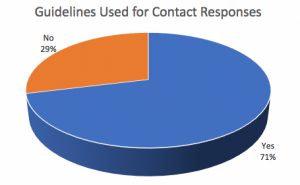
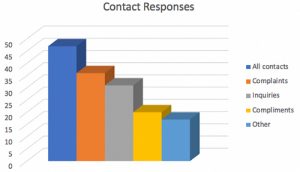
Guidelines for Contact Responses
Respondents were asked if they have guidelines for what contacts they respond to and over 70% indicated that they do have guidelines. Participants were offered several options for what those guidelines require with multiple choices accepted. Approximately 30% respond to all inquiries, while complaints and inquiries are the next most popular choices at 24 and 21%. Only 13% respond to compliments which may represent a missed opportunity to support the company’s biggest fans and to build brand loyalty.
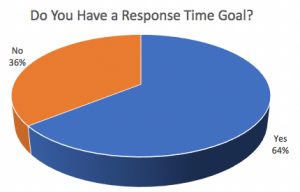
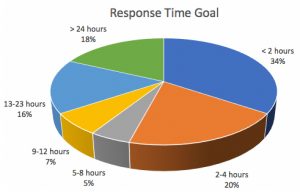
Response Time Goal
Approximately two-thirds (64%) of the respondents indicated that there is a response time goal for answering social media contacts. Approximately one-third have a goal of less than 2 hours with another 20% focused on 2 to 4 hours. The remainder of the responses range to beyond 24 hours. It is common for customers to compare the results of their postings between companies that they interact with, although that generally means between companies in unlike businesses (such as the utility, bank, and catalog company a single customer uses rather than multiple banks, the customer does not utilize). As a result, comparing your center’s performance to only others in your industry may not serve as a very useful guideline for setting your goals.
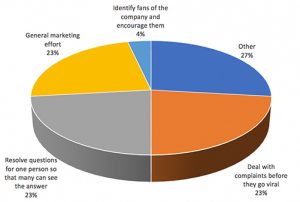
Objective for Social Media Program
Respondents were asked if they have an objective in place for their social media programs and slightly more than half indicated that they do. When asked to select an objective from those listed in the survey, 27% of respondents chose “other.” Twenty-three percent each chose the next three options while only 4% indicated that their objective is to identify and encourage the company’s fans.
Single Most Challenging Aspect
Respondents were asked to identify the single most challenging aspect of monitoring and assessing quality of social media responses. The following are the most common responses:
- Time needed to manually monitor, research issue, and discuss response with others.
- Maintaining the “voice of the customer” across multiple channels.
- The volume and speed of response expectation.
- Staffing the wide variations and unpredictable peaks. One comment can spark a flurry of others, for example.
- Monitoring for all hours.
- Responses often require interaction with other departments.
- Separating real customers from “media trolls.”
Conclusion
This survey provides insight into the tools and processes utilized in monitoring and assessing quality on social media processes. It is clear than many organizations are expecting the contact center to take on at least some responsibility for responding to social media postings. However, that process may involve discussions with other departments and research to identify the actual customers and their issues. The volume is unpredictable as one comment can be picked by others, creating multiple postings on a single issue. Customers can and will post at all hours (even when the contact center is not open) making it difficult to staff and meet response time goals.
There is little doubt that the use of social media will continue to grow and its importance in managing customer experience and brand loyalty will increase. Social media provides an opportunity to provide a one-to-many interaction which can be useful for educating, communications and development of fans. Careful management and control of the quality of responses is critical as the postings are highly visible and in writing.